

Carbon Footprint Data & Analysis
Specialist consultancy calculates the carbon footprint of the whole supply chain
For Carillion Communications Limited, understanding our carbon footprint means looking beyond the emissions from our own operations. We have considered the wider value chain, from the goods and services we purchase through to the products and services we deliver, following GHG Protocol across all three emissions scopes.
Data gathered was a hybrid set based on the GHG protocol hierarchy which specifies four levels of data that can be captured: 1) Supplier specific, 2) Hybrid, 3) Industry average and 4) Spend-based.
For scopes 1 and 2 detailed invoiced electricity and gas consumption and owned transportation data was available together with the relevant carbon conversion factors and will therefore be highly accurate.
Scope 3 data is notoriously difficult to measure in the supply chain so as a first pass estimation the spend-based analysis method has been used. The method is approved by the Department of Energy Security and Net Zero (DESNZ) within its Streamlined Energy and Carbon Reporting emissions and is based on a model developed by the University of Leeds available as open source on the DESNZ website.
Carillion Communication Limited are using a baseline year of 2024 as a springboard to enable us to track progress to net zero by 2035 for operational emissions.
A series of carbon and wider Environmental Social Governance activities provide an engaging set of activities to drive business emissions downwards to carbon net zero and to engage its supply chain to follow a similar path. The net zero target is for operational emissions over which Carillion Communications Limited has direct influence. Scope 3 emissions targets are much more difficult to set and achieve and we have selected out transportation as something tangible where we can engage with our supply chain partners.
The in-depth analysis will be maintained until we hit our net zero target and will enable our investors and other stakeholders to understand our desire to be as open and comprehensive in our analysis of carbon with a view to establishing a robust financial impact of the required technological changes to get to net zero and the benefits of a clear set of metrics to map progress.
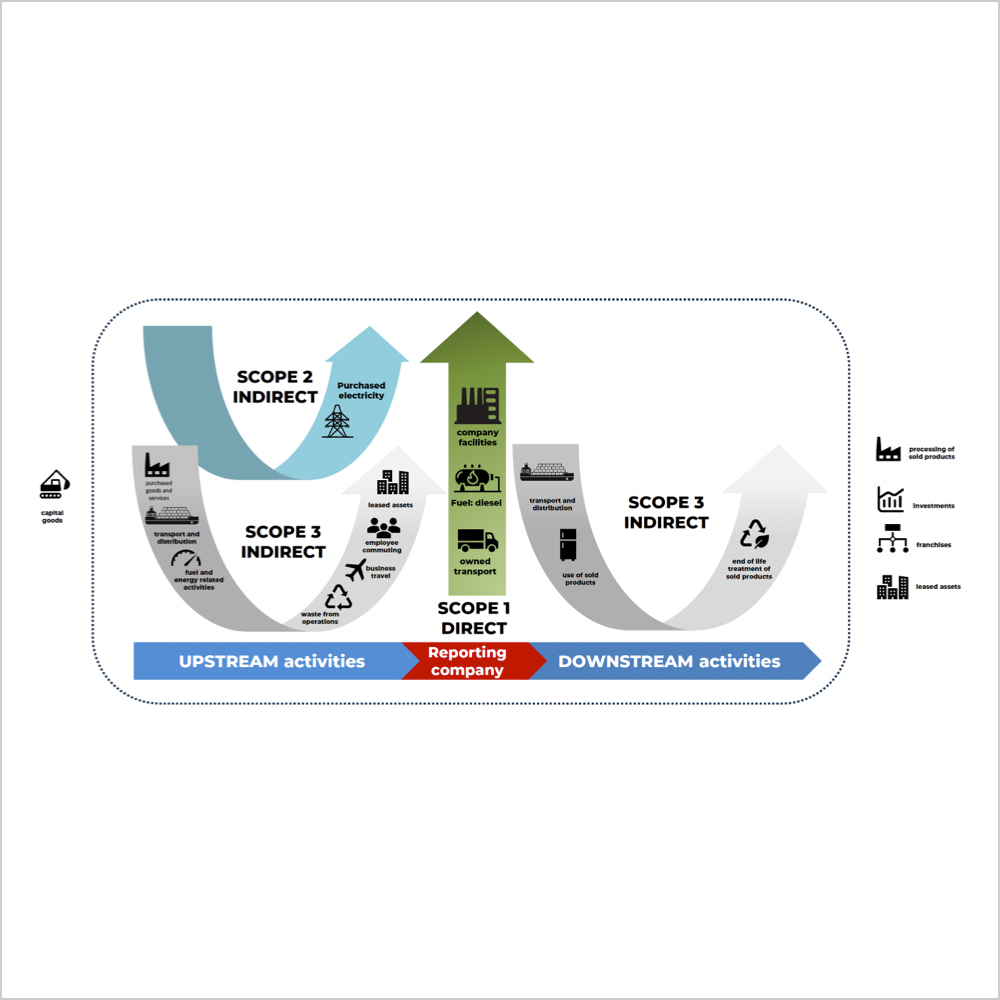
GHG Emissions Reporting Boundaries
Carbon footprint has been mapped from the supply of goods and services to delivery to customer.
The map here shows inside the items included in the calculations and outside the dotted line the items that have been excluded primarily because data is not relevant to our operational model.

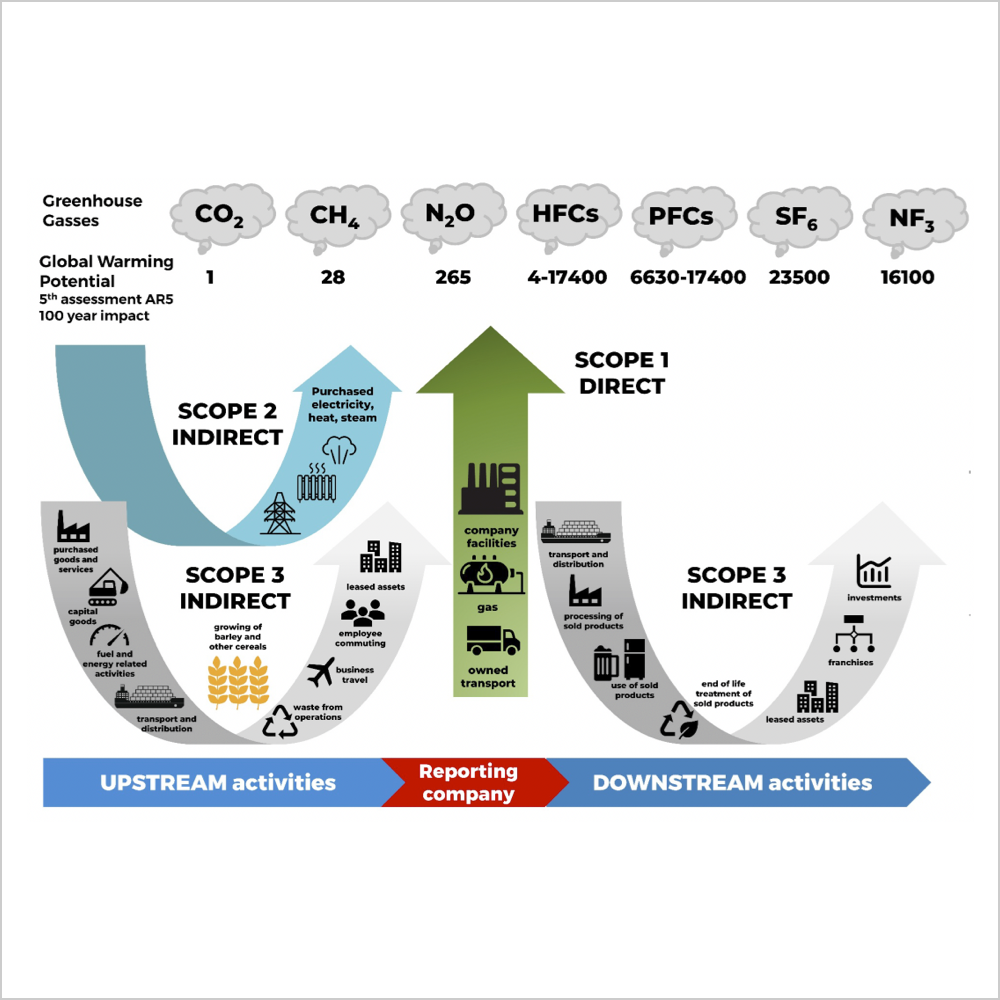
Carbon Footprint Scopes Explained
Carbon Footprint is a generalised term that converts all seven greenhouse gasses into an equivalent based on global warming potential.
There are seven gasses that need to be considered in calculating a carbon footprint.
Each has a global warming potential (GWP) factor which differs slightly depending on the report you consult, but overall, the relative warming potential is the same.
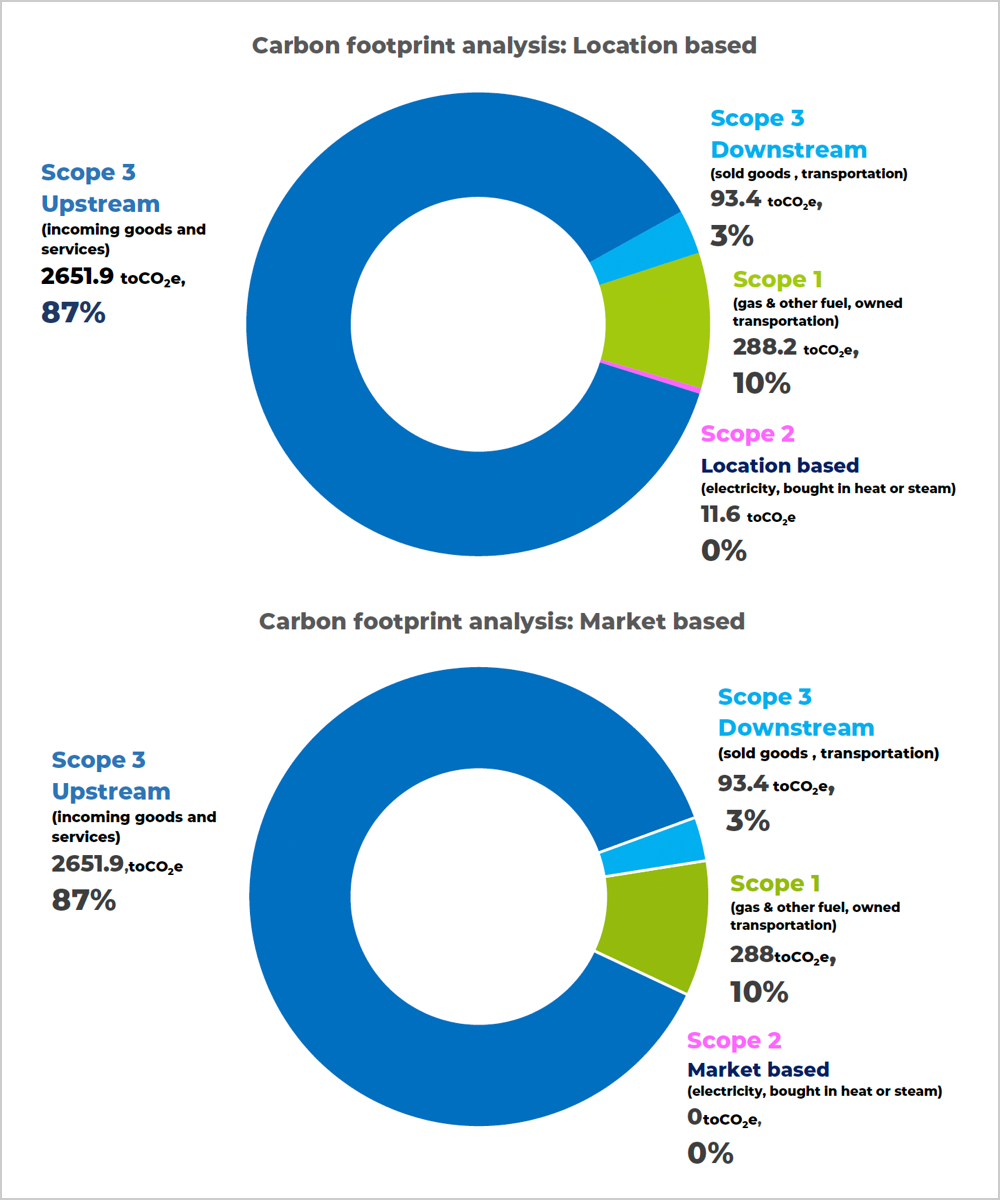
Carbon Footprint Data: Scopes 1-3
This graph shows the location-based carbon footprint which uses the grid average electricity emissions factor. We also show our market-based analysis which has zero scope 2 emissions because we purchase verified zero carbon electricity.
We have been thorough in our calculation and follow the GreenHouse Gas Protocol. Calculations include full emissions for the generation and transportation of all the fuel sources in addition to the use of those fuels which is the kWh or litres invoiced.
Our market-based contract saves the equivalent emissions of the annual mileage of 3 family cars.
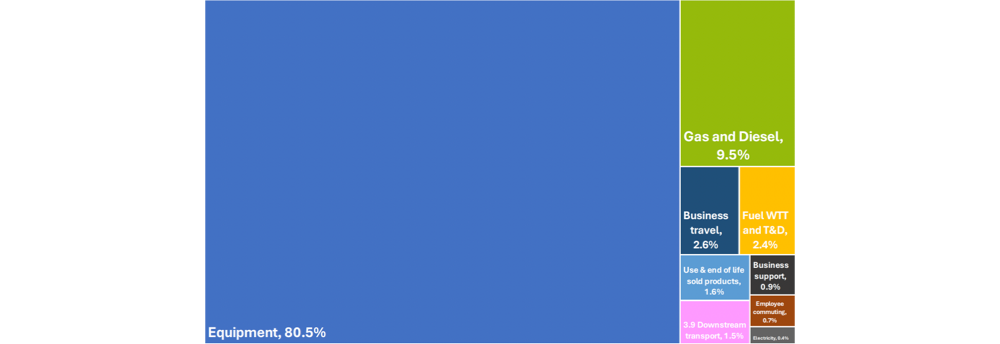
Overall Carbon Footprint Apportionment for Carillion Communications Limited
The contributions of the various parts of scope 1-3 carbon footprint are represented in the chart The embedded carbon in the purchased electrical equipment is indicative of the highly specialised nature of the business and the type of equipment it needs to purchase. Most of the Gas and Diesel component is associated with the fleet used in business operations.
Fuel generation includes the emissions due to the energy used in generating the electricity (well to tank emissions) and for both electricity and gas the transmission and distribution losses in delivering the fuel to site through the network.
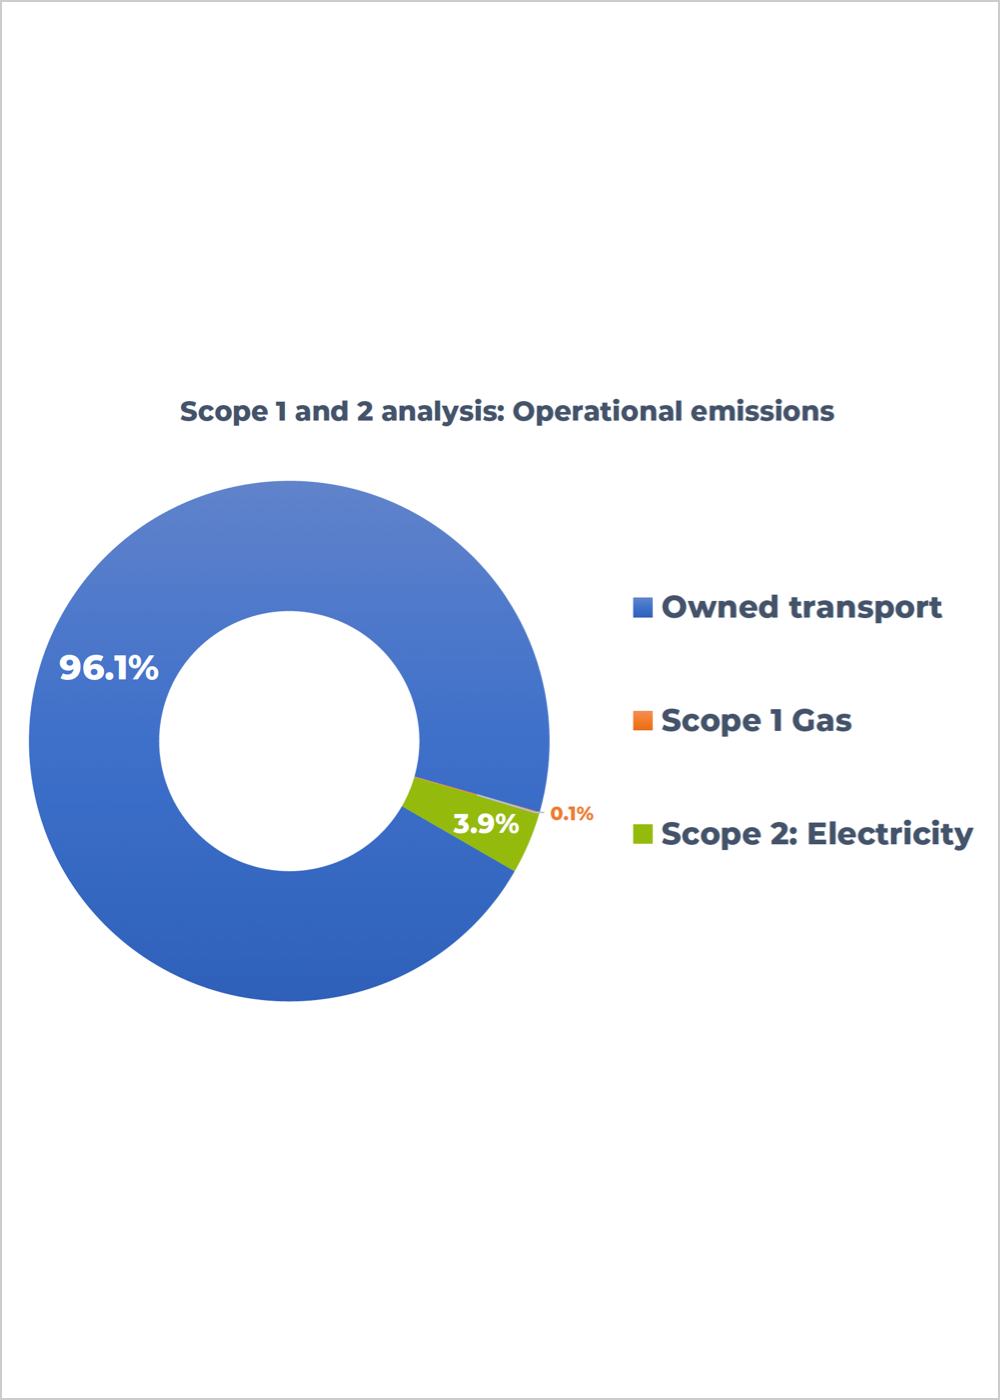
Carbon Footprint Data: Operational (Scope 1 and 2) Emissions
Scope 1 Carbon Plan
The nature of our business is that we travel and deliver solutions to clients. The emissions from our owned transport are reported as scope 1. Distribution by third parties is reported in scope 3. We continue to be vigilant to opportunities to invest in lower emissions transportation where this has a financial and environmental justification. Gas use is small and reduction here is dependent on national strategies to introduce hydrogen into the gas supply or make the cost of switching to zero carbon electrical options cost effective.
Scope 2 Carbon Plan
By 2040 the national electricity grid is set to become net zero by virtue of investment in zero emissions generation. At that point our scope 2 emissions will become zero by default.
Carbon Footprint Data: Scope 3 Upstream Incoming Goods and Services Analysis
We have mapped all business and employee transportation and included hotel stays, flights, train journeys, road mileage.
Purchased goods and services are primarily electrical equipment associated with our installed solutions.
What are Fuel and energy generation and transmissionemissions?
WTT = Well to tank emissions – those associated with generating gas and electricity at the generation site.
T&D = Transmission and distribution losses through the distribution network.
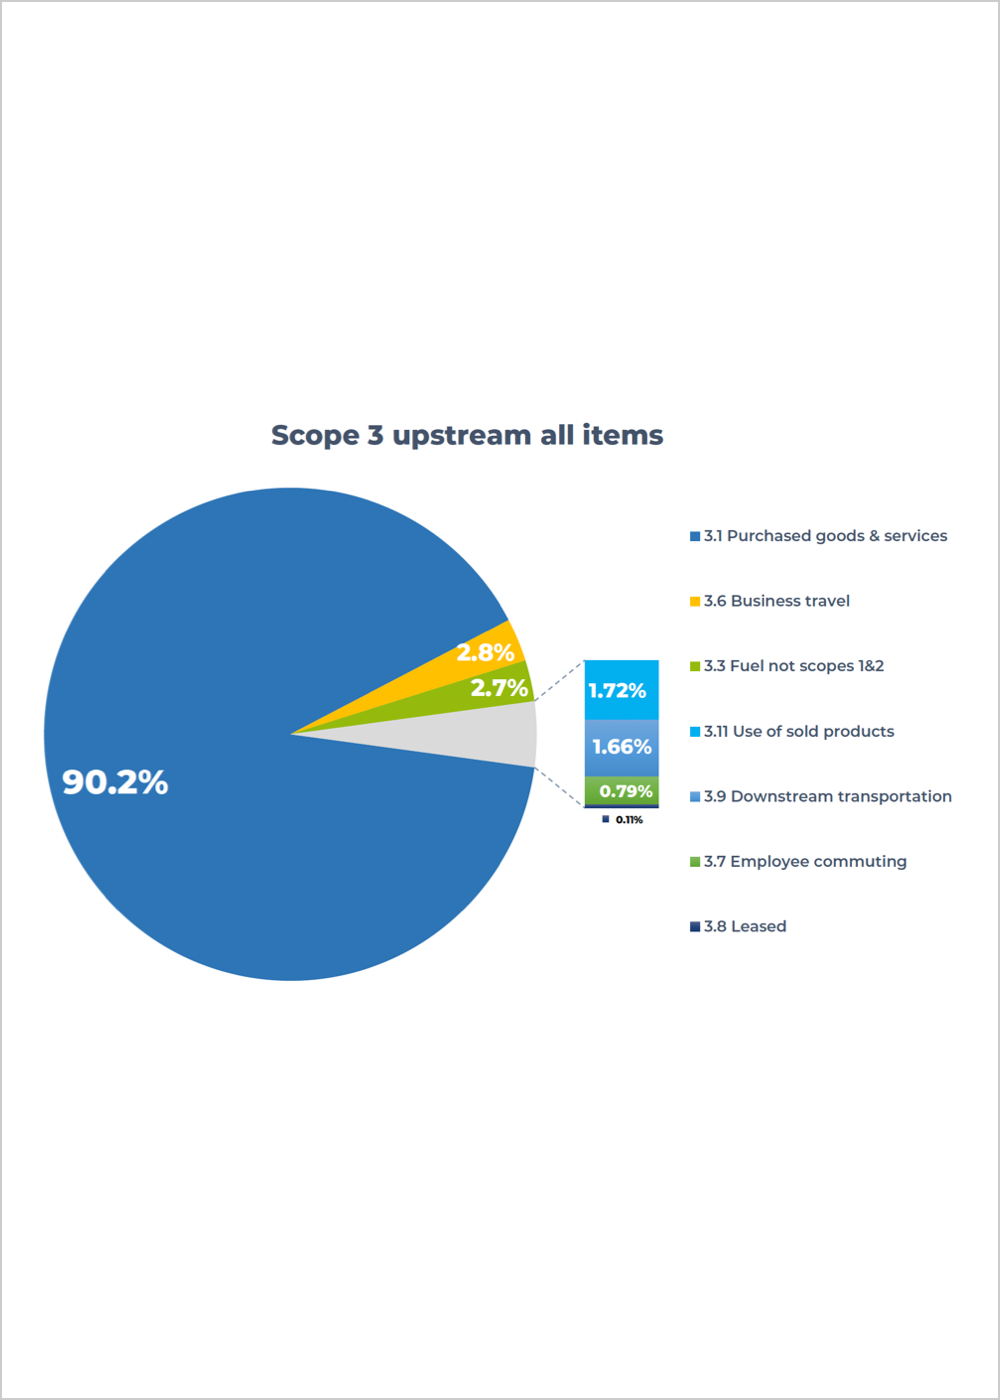
Scope 3 Carbon Plan: Upstream
Improvements in embedded carbon in the main category will come from activities from our suppliers. We already source the lowest operational electrical usage equipment on the market. Manufacturers particularly in the UK and Europe will benefit from the decarbonisation of the national electricity supply so will by default reduce. The current analysis is based on spend and those conversions do not reflect specific emissions from named suppliers so we will engage with suppliers to request their own carbon footprint data so that we can map their reduced impact in real terms.
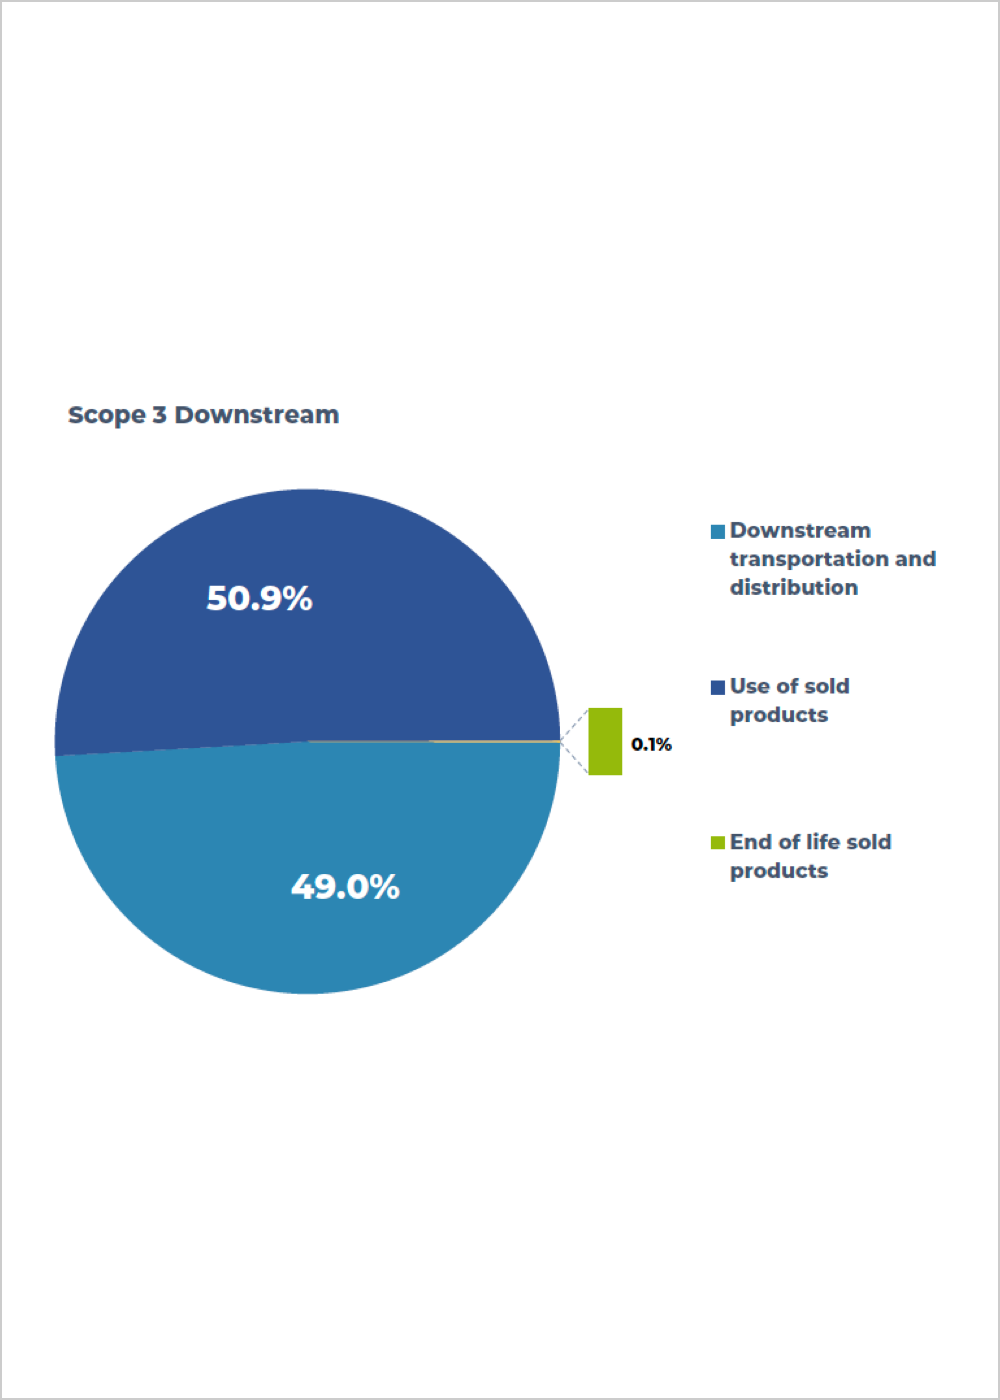
Carbon Footprint Data: Scope 3 Downstream – Emissions Associated with Product Use
The contribution of transportation (50.9%) is not surprising because equipment needs to be delivered to clients and that cannot be avoided.
We have mapped as accurately as possible the emissions associated with the use of sold products we install. We used a weighted measure of the standby and operational electricity consumption with data provided by the manufacturers and assumed a 3-year lifetime use (49.0%).
End of life impact of sold (installed) products was calculated as the impact of recycling the electronic and other components into new equipment (0.1%).
Factors for all these calculations are available on the UK government database for company GHG reporting.
Scope 3 Carbon Plan: Downstream
As electric vehicles range and cost continues to decrease it is possible that we can replace vehicles with EV or potentially our larger fleet vehicles with HVO fuel options to reduce scope 3 downstream emissions substantially.
The use of sold products is based on electricity usage so when the electricity grid supply in the UK becomes net zero in 2040 all our installations in the UK will become net zero which is the largest part of our sales network. Our chosen screen installations are 11%-36% lower emissions compared to manufacturer data from other brands of the same screen size.
Carbon Net Zero or Carbon Neutral? Carbon Net Zero is the Gold Standard Chosen by Carillion Communications Limited
Carbon Neutral:
A company purchases carbon credits from activities in which external operators have removed CO2 from the atmosphere and have had these verified as credits usually offered in tonnes CO2e for others to buy. This does not in fact reduce any of your carbon emissions and is simply a mathematical way to balance out emissions and removals.
Carbon Net Zero:
This is a status where CO2 emissions have definitely been reduced and not just balanced out. A carbon net zero strategy can involve becoming lean in terms of efficiency, green in terms of selection of low or zero emission fuels and mean if any activities can be stopped. The latter ‘mean’ category is exceptionally difficult to find for most businesses. It is also likely that technology does not yet exist for companies to become entirely carbon net zero.
There are many business leaders who have announced carbon net zero targets believing that they can buy carbon credits to get to that position. That would be a carbon neutral target not a carbon net zero target and frankly not relevant in the context of the entire global population and businesses needing to make real reductions in carbon at source not rely on the mitigating actions of others.

Carillion Communications Limited have set a carbon net zero target Operational (scope 1 and 2) emissions to be net zero by 2035 Scope 3 to be net zero by 2050
No more than 10% of these reductions should be reliant on the purchase of carbon offsets (credits) in line with the principles of science-based target guidelines.
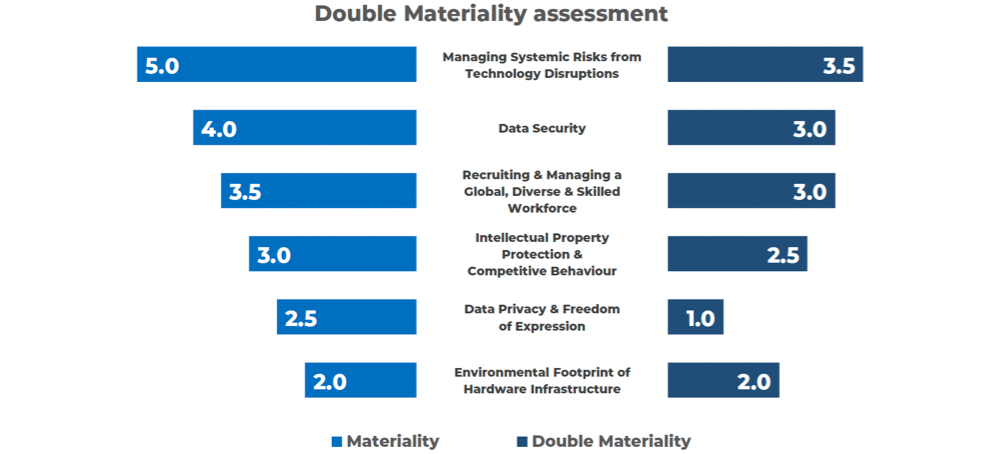
Materiality and Double Materiality as determined from IFRS S1 and S2 reporting requirements
Materiality is the list of climate related issues that have the potential to cause financial impact on our sector.
Our materiality risk is determined from the SASB IFRS materiality assessment for the Software & Information Technology (IT) Services industry.
The scope of this materiality assessment describes the sector as offering products and services globally to retail, business and government customers, and includes entities that develop and sell applications software, infrastructure software and middleware. The industry generally is competitive but with dominant players in some segments. Although relatively immature, the industry is characterised by high-growth entities that place a heavy emphasis on innovation and depend on human and intellectual capital. The industry also includes IT services entities delivering specialised IT functions, such as consulting and outsourced services. New industry business models include cloud computing, software as a service, virtualisation, machine-to-machine communication, big data analysis and machine learning. Additionally, brand value is important for entities in the industry to scale and achieve network effects, whereby wide adoption of a particular software product may result in self-perpetuating growth in sales.
Double Materiality is the financial impact of the material issues identified. It also widens the scope of the materiality assessment to all areas of ESG.
In our system we have used a number to evaluate the relative risk on a 0-5 sliding scale in each material category and the double materiality is the relative investment of financial resources we deem may be required to address that issue. The supporting data in the SASB format follows.
Other metrics reported: We also report metrics that are aligned with the EU Corporate Sustainability Reporting Directive (CSRD). The guidance for report is the Environmental Sustainability Reporting Standards (ESRS).
In the Key Performance Data tables shown below we reference the relevant ESRS standards:

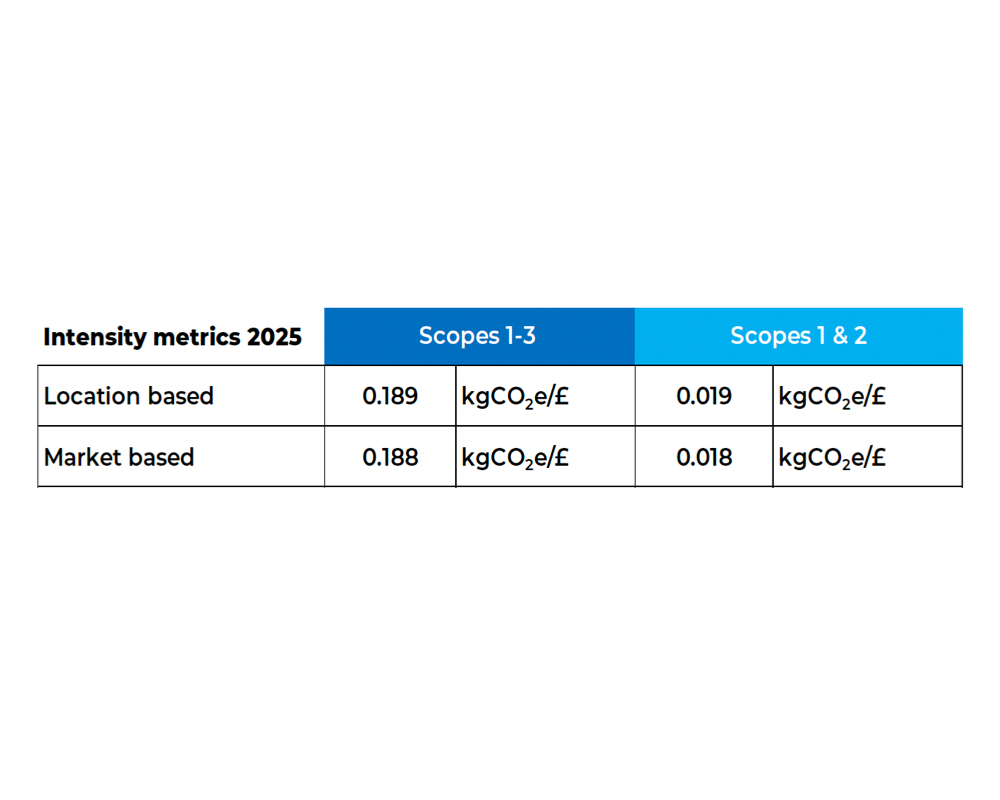
Carbon Intensity Data
The nature of our products does not fit a metric based on product weight, but it can be helpful to assign a value based on cost or our overall turnover. This aligns with the type of metric required by the Streamlined Energy and Carbon Reporting regulations. Although we are not required to report under that legal framework this type of metric is often requested. It is simply a guideline and it would be possible to generate a carbon footprint at a specific project level if required.
Internal Price of Carbon
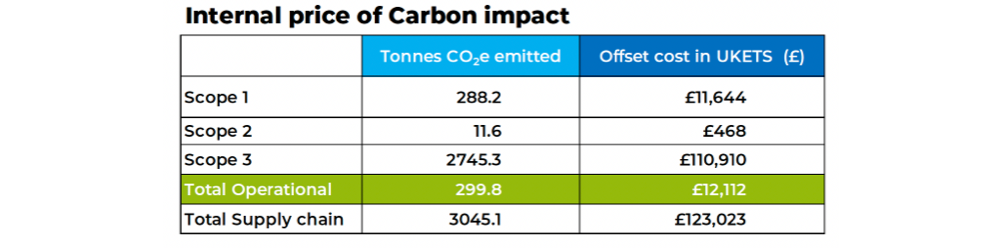
Carillion Communications Ltd are not proposing to use carbon offsets at this point, but it is an option for the future if no other solutions are available to reach carbon reduction targets. There are carbon markets where carbon credits can be bought. They fall into two categories: legal and voluntary. The voluntary carbon markets are not always that well-regulated and currently would not be accepted as mitigation for emissions within a legal taxation framework in the UK or Europe.
The carbon price chosen in this report is based on the UK Emissions Trading Scheme (UKETS). Carillion Communications Ltd are not required to be part of the UK ETS hence the prices for carbon compliance are for guide purposes only.
This cost is referred to as an Internal Price of Carbon (IPC) which can be used in assessing capital and operational savings as an additional financial metric.
Data is shown for all 3 scopes for illustration purposes only. There is not requirement nor any justification for paying to neutralise emissions at the moment.
Scope 2 emissions will become carbon net zero by 2040 so only the scope 1 offset cost is potentially of interest to Carillion Communications Ltd if a carbon net zero operational commitment is required. The current cost is £12,112 each year.